
 FR
 EN
Source connectivity
ERP, CMMS, CRM, Excel files: we collect the data where it lives, automatically.
Dashboards connected to your data, with no copy-pasting. And business applications when no off-the-shelf software fits.
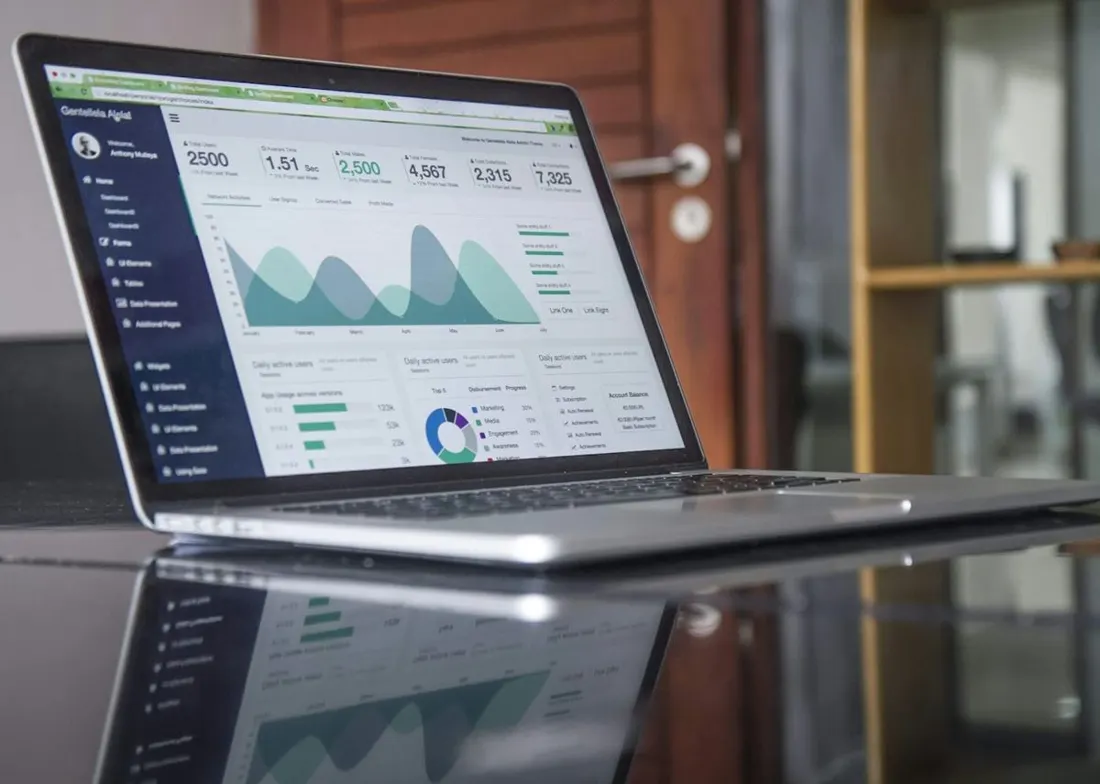
Revenue
+12 %
Margin
34 %
Example, updated every morning
Your teams spend hours compiling data in Excel. By the time the report arrives, it is already out of date.
ERP, CMMS, CRM, Excel files: we collect the data where it lives, automatically.
Data is cleaned and kept with its history in one database. Everyone reads the same figures.
Management, production, finance: everyone sees what concerns them. Power BI, Metabase or Tableau, depending on your tools.
An email when a threshold is crossed, instead of finding out at month end.

A dashboard is only as good as its data. Before drawing a single chart, we list where each figure comes from: the management software, the accounts, a spreadsheet kept by hand, a machine.
We then bring them together in a reference database that updates itself every night or every hour. Your indicators are always calculated the same way, whoever looks at them.
In meetings, you discuss the decisions to make, with figures everyone accepts.
Some processes still run on Excel files, paper and emails. We replace them with a web application built for your teams.
One interface per user role, on computer, tablet and phone.
Every entry and every approval is dated and attributed. You can see who did what.
The application exchanges data with your ERP, your CMMS or your accounting through APIs.
We host the application in France, back it up and keep improving it.
We start with your questions, not with charts: which figures do you look at every week, and which decisions depend on them? From that we draw a short list of indicators, each with a written definition.
Then we connect your sources and reconcile the figures with your accounts before showing anything: a dashboard you doubt is useless. After that, the data updates itself.
Already using Power BI or Tableau? We work with it. With no tool in place, we can start with Metabase, which is open source and can be hosted on your own servers. What matters is not the tool but the quality of the data behind it.
Some trades have rules too specific for off-the-shelf software. We then build a web application made for your process. It is hosted in France, backed up, and it evolves with you.
A record deduplication script, connected to 4 sources: document management, Cegedim, Zendesk and Azure SQL Database.
Read the case study →A critical Excel file replaced by a web application, in 9 months, at Brüggen, a cereal manufacturer.
Read the case study →A first 30-minute conversation, free and with no commitment.