 FR
FR
 EN
EN
Dashboards and Reporting
Automated reporting connected to your existing systems. Reliable real-time indicators.
Starting from 5,000 EUR excl. VAT
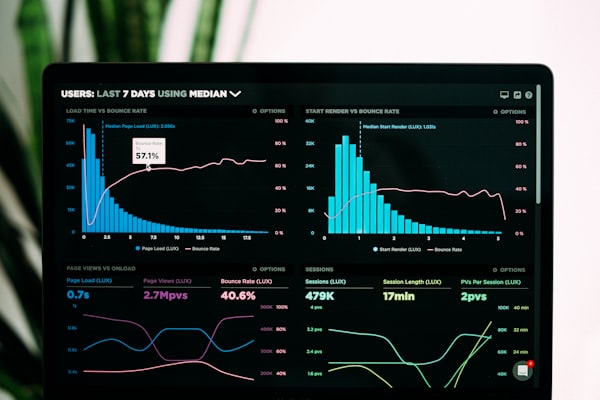
A dashboard connected to your sources
Key indicators in real time, directly in your browser. No more hours of copy-pasting in Excel.
Your teams spend hours compiling data. By the time the report arrives, it is already outdated.
What we observe
Manual Excel reporting
Hours of copy-pasting to consolidate data from different systems into an Excel file.
Outdated data
Reporting arrives 5 to 10 days late. Decisions are made based on already outdated figures.
No proactive alerts
Anomalies are detected after the fact, when it is too late to take effective action.
Data silos
Each department has its own files. It is impossible to get a consolidated view of operations.
Our solution
Dashboards connected to your sources, with no re-entry
Source connectivity
ERP, CMMS, Excel files, IoT sensors — we connect everything automatically.
Real-time dashboards
Interactive visualizations tailored to each profile: management, production, quality.
Automatic alerts
Immediate notification in case of threshold exceedance or detected anomaly.
Single Source of Truth
All data consolidated in a reliable, historized data warehouse.
Rapid iterations: visible results from week 2
We don't spend 3 months writing specifications. Within 2 to 4 weeks, you have a functional dashboard connected to your real data, ready for your teams to use.
- Source audit — mapping of your existing data, identification of key indicators with your business teams
- Automated pipelines — extraction, transformation, and loading of data with no manual intervention
- Dashboards — interactive visualizations co-built with end users
- Training and autonomy — your teams master the tool and can create new views
Audit
Data source mapping, identification of priority KPIs, scoping with management
1 weekETL Pipelines
ERP, CMMS, file connectivity. Automated extraction, cleaning, and loading into the data warehouse
1 weekDashboards
Dashboard construction by user profile, with configured alerts and notifications
1 to 2 weeksTraining
User training, documentation, knowledge transfer, and support
OngoingFrom your data sources to your dashboards, everything is connected with no manual intervention.
 Power BI
 Metabase
 Tableau
 PostgreSQL
 Python
 Airflow
Before/after comparison of reporting processes at an industrial site.
What changes with a connected dashboard
Key points
What our clients ask us
What ERPs can you connect?
We connect all common ERPs: SAP, Sage (X3, 100), Divalto, Cegid PMI, Microsoft Dynamics, as well as CMMS, LIMS, and any database accessible via SQL or API.
Do we need to replace our existing tools?
No. We connect to your existing systems without modifying them. Data is automatically extracted to a dedicated data warehouse, with no impact on your production tools.
Power BI or Metabase: how to choose?
Power BI is ideal if you are already in the Microsoft ecosystem (Office 365 licenses). Metabase is an open-source alternative with no license cost, perfect for SMEs. We advise you based on your context.
How long does it take to get a first dashboard?
Generally, a first functional dashboard is available within 2 weeks. The full project (all views, alerts, training) takes 2 to 4 weeks depending on complexity.
Have you identified a need?
Free 30-minute diagnostic — no commitment, confidential.