Bidev Consulting Logo
About
Production continue et maintenance prédictive
CONTINUOUS PRODUCTION

Zero Unplanned Downtime
Predictive Maintenance & Energy Monitoring

Optimize your 24/7 production, anticipate failures and reduce your energy consumption with AI and IoT.

Request a free diagnostic →
The challenges of continuous production

Maintaining 24/7 operations without interruption, anticipating failures through predictive maintenance and optimizing energy efficiency are the major challenges facing continuous production manufacturers.

Your daily challenges

!

Costly unplanned downtime

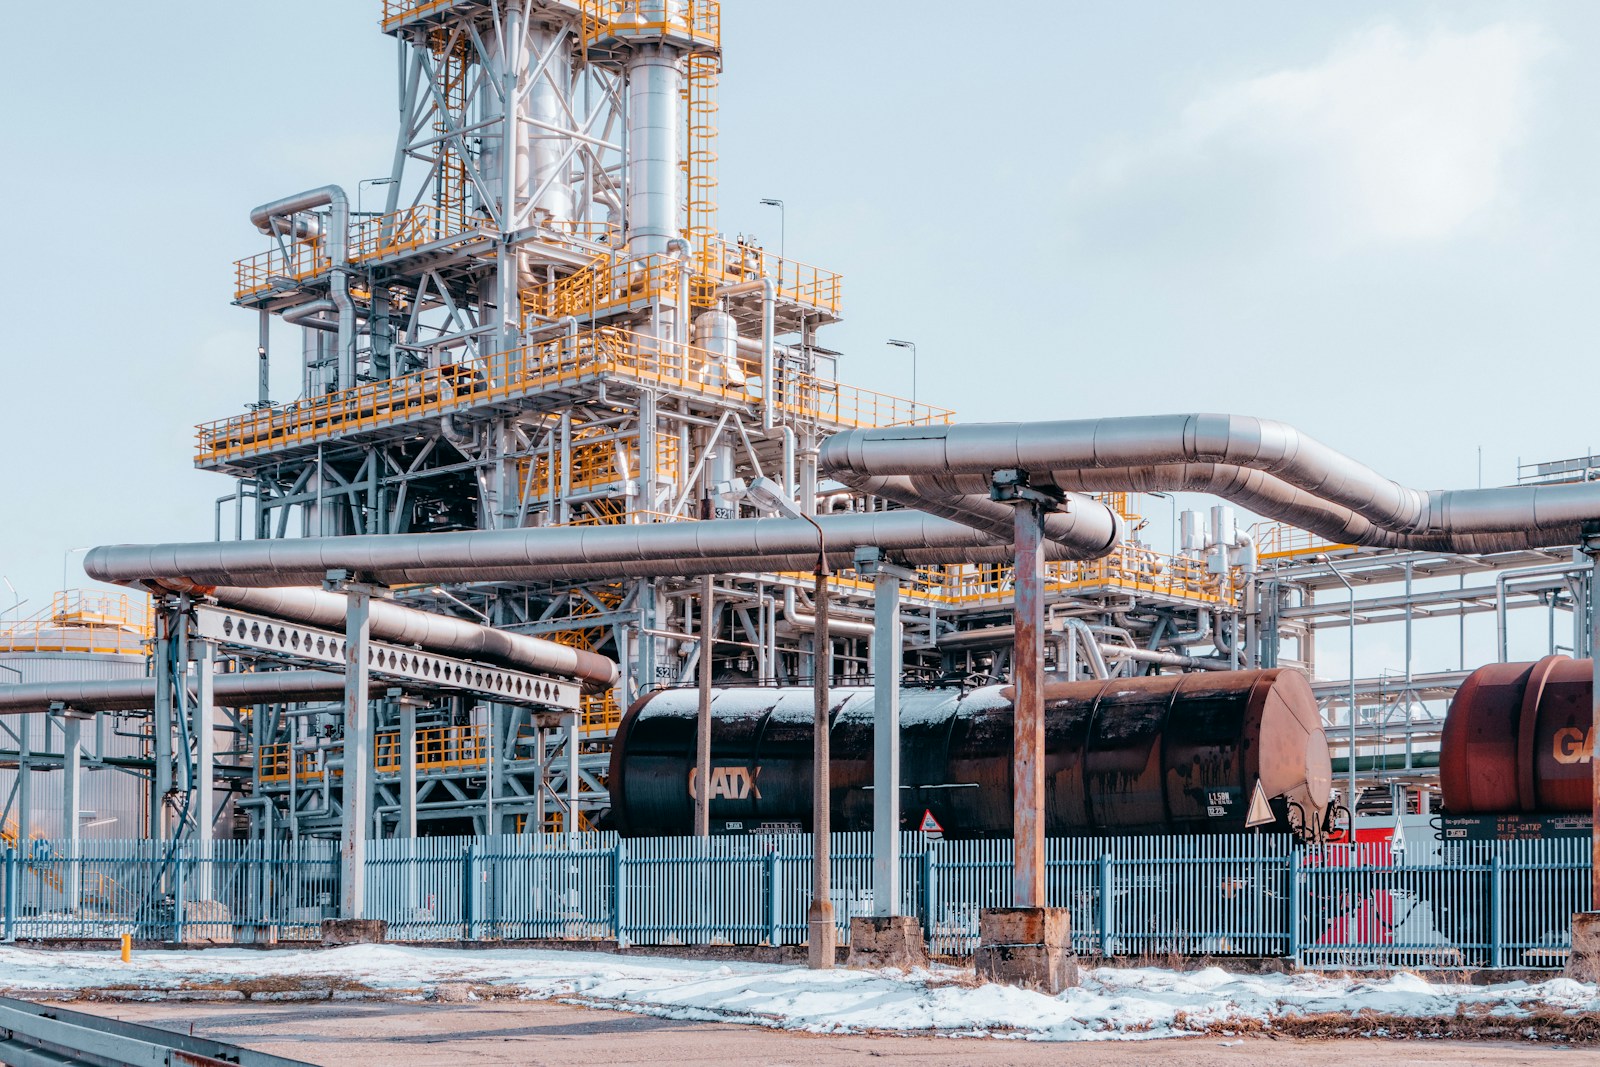
Each furnace stoppage = tens of thousands of euros lost and delayed production.

!

Reactive maintenance

You repair after the breakdown instead of anticipating. Costs x3 compared to predictive.

!

Invisible energy drift

Without real-time monitoring, excess consumption goes unnoticed for months.

!

Insufficient quality control

On continuous lines, defects go unnoticed due to the lack of automated inspection.

Our support

Custom SaaS solutions and consultants embedded in your teams

AI predictive maintenance

IoT sensors + ML to predict failures before they occur.

Energy monitoring

Dashboard per equipment. Drift alerts. Automatic consumption optimization.

In-line quality control

Computer vision for 100% automated inspection on your glassware lines.

Maintenance planning

Intelligent CMMS: optimal scheduling of maintenance activities based on production.

-45%
unplanned downtime
-20%
energy costs
+15%
yield rate
ISO 9001 ISO 14001 ISO 50001
Predictive maintenance
Energy tracking
Inline inspection
Yield KPIs
Sensor monitoring
Planning
Real-time alerts
Data analysis

Anticipate failures, take control of your energy

Free audit of your maintenance strategy within 48h

Request a diagnostic →
Intelligent maintenance

Anticipate failures with IoT predictive maintenance

Move from costly reactive maintenance to a predictive approach based on sensor data and machine learning. Detect early signs of failure and schedule your maintenance at the optimal time.

  • IoT sensor data collection — vibration, temperature, pressure, flow and current collected continuously from your critical equipment
  • ML predictive models — machine learning algorithms trained on your failure history to predict upcoming breakdowns
  • Intervention planning — work orders generated automatically and scheduled according to optimal maintenance windows
  • Spare parts management — inventory sized on reliable data, anticipated procurement and reduction of dormant stock
1
Diagnostic

Audit of critical equipment, mapping of existing data and definition of maintenance objectives

1 to 2 weeks
2
Design

Technical architecture, IoT sensor selection, pilot on critical equipment and validation

2 to 4 weeks
3
Development

Iterative development: sensor data collection, ML predictive models, alerts and intervention planning

6 to 12 weeks
4
Deployment & Support

Production deployment, extension to new equipment, model improvement and ongoing support

Ongoing
Energy performance

Take control of your energy consumption in real time

Identify waste, optimize your load profiles and manage your energy performance with real-time dashboards. ISO 50001 compliance included.

  • Real-time consumption monitoring — tracking per equipment, workshop and production line with minute-level granularity
  • Waste identification — automatic detection of excess consumption, leaks and deviations from reference profiles
  • Load profile optimization — consumption peak smoothing, peak-hour load shedding and automated tariff arbitrage
  • ISO 50001 reporting — compliant dashboards, energy performance indicators (EnPIs) and automated audit reports
−30%
Energy usage
Measured reduction
100%
Visibility
Every piece of equipment tracked
ISO 50001
Compliance
Automated reporting
24/7
Real-time monitoring
Instant alerts
Industrial performance

Manage your OEE/TRS in real time

Measure and optimize your Overall Equipment Effectiveness in real time. Identify micro-stoppages, track throughput and quality, and compare performance across lines to achieve operational excellence.

  • Real-time OEE calculation — availability, performance and quality calculated continuously with loss breakdown by category
  • Micro-stoppage analysis — automatic detection and classification of short stoppages invisible in traditional systems
  • Throughput/quality tracking — production speed and scrap rate monitoring by product, team and period
  • Cross-line benchmarking — performance comparison across lines, teams and sites to identify and replicate best practices
SensorsIoT · PLCs
SCADASupervision · Control
MESProduction · Traceability
▼ ▼ ▼
BiDev AnalyticsOEE Calculation · ML · Correlations · Automatic Optimization
▼ ▼ ▼
DashboardsTRS · OEE · KPIs
AlertsThresholds · Anomalies
ReportsTeam · Line · Site
Field digitalization

Digitalize your rounds and inspections field

Replace paper forms with digital rounds on tablet. Dynamic checklists, anomaly photos and automatic escalation for full traceability and increased responsiveness.

  • Rounds on tablet — ergonomic mobile application with offline mode, geolocation and NFC for checkpoint validation
  • Dynamic checklists — adaptive forms based on equipment, history and previous results with automatic calculations
  • Field photos/annotations — photo capture with direct annotations, timestamping and automatic linking to the relevant equipment
  • Automatic escalation — out-of-tolerance value detection and immediate alert triggering to maintenance managers
1
Zone check-in

NFC badge, geolocation and round start

NFC
2
Measurement readings

Tablet input, automatic calculations

Auto
3
Anomaly photo

Capture and annotation on the equipment

IA
4
Automatic alert

Maintenance escalation if out of tolerance

Alert
5
Digital report

Round report generated automatically

Audit
-45%
Unplanned downtime
on critical equipment
-30%
Energy consumption
through real-time monitoring
+15%
OEE/TRS
overall equipment effectiveness
100%
Digitalized rounds
full field traceability
The tools we master and integrate

In-depth knowledge of the continuous production and process manufacturing technology ecosystem, gained through hands-on experience.

SCADA / DCS

Real-time process supervision and control

MES

Production tracking, batch records and traceability

GMAO

Preventive and predictive maintenance and intervention management

Energy / EMS

Consumption monitoring, meters and ISO 50001

Historian

PI, Wonderware — process data and analytics

Python

Python

RAD, dashboards, ML models and integrations

IoT / Sensors

Vibration, temperature, pressure and flow

OT cybersecurity

Industrial network and SCADA security

Return on investment concrete

Before/after comparison on key processes of a continuous production site.

The total cost of one hour of unplanned downtime is 5 to 20 times higher than the cost of the repair itself. Realistic target: reduction of 30 to 50% of breakdowns in 12 months.

Concrete ROI for your site

Indicator
Before
With BiDev
Maintenance strategy
Reactive (fix after failure)
Predictive (anticipate before failure)
Energy tracking
Monthly manual readings
Real-time per equipment
Intervention planning
Paper / Excel
Intelligent CMMS
Drift detection
After the breakdown
Automatic alerts

Does this sound like you?

If you check 3 of these 5 warning signs, it's time to take action.

What our clients ask us

What types of sensors are needed?

Vibration sensors (200-500€/unit), temperature sensors (50-150€) and connected clamp meters (100-300€). Battery life of 2-3 years, wireless installation.

What ROI can be expected from predictive maintenance?

Realistic target: 30 to 50% reduction in unplanned breakdowns within 12 months. The cost of one hour of unplanned downtime being 5 to 20 times higher than the repair, ROI is quick.

Do we need to replace our existing CMMS?

No. Our solution connects to your existing CMMS and enriches it with sensor data and predictive intelligence. No migration required.

How long does it take to move from reactive to predictive?

The realistic goal for an SME is to move from reactive to condition-based preventive maintenance in 12-18 months. The AI predictive level is a 3-5 year horizon.

Ready to transform
your maintenance and energy monitoring?

Free audit of your processes within 48 hours. Our experts analyze your needs and propose a tailored solution.

Contact us →